
Abstract
Background: To evaluate the association between facility-level adoption of vaporous hyperoxia therapy (VHT) and the publicly reported prevalence of pressure ulcers (PUs) among long-stay residents in Florida nursing homes.
Methods: We conducted a retrospective observational study using sponsor device-use records linked to public Centers for Medicare & Medicaid Services (CMS) Care Compare data. A total of 28 VHT-adopting facilities were matched within adoption-quarter cohorts to 79 unique comparison facilities with no VHT device placement during or before follow-up. A Bayesian staggered difference-in-differences hurdle-beta model estimated the standardized association over the first four complete quarters after initiation.
Results: VHT adoption was associated with a 1.22-percentage-point lower CMS PU rate (95% credible interval [CrI], −2.07 to −0.42) than the estimated counterfactual rate without adoption. This corresponded to a 23.7% relative reduction (95% CrI, 9.6% to 36.2%). The exploratory difference in the probability of a reported CMS rate of 0.0 was +3.33 percentage points (95% CrI, −0.37 to +7.97), with a probability ratio of 1.99 (95% CrI, 0.91 to 4.11).
Conclusions: VHT adoption was associated with a lower facility-level CMS long-stay PU rate in this Florida cohort. The observational design, short pre-adoption period, and concentration of adopters within one operator limit causal interpretation and generalizability.
Pressure ulcers (PUs) remain an important clinical challenge in nursing homes and skilled nursing facilities. Residents in these settings frequently have multiple risk factors for PU development and persistence, including limited mobility, advanced age, incontinence, vascular disease, and other complex comorbidities. Persistent and more severe PUs are associated with complications including infection and hospitalization and contribute to substantial clinical and resource burden for residents and care facilities.1–3 Effective prevention and management of PUs therefore remain important components of nursing-home care.
The importance of PU management extends beyond individual wounds and residents to facility-level quality assessment. The Centers for Medicare & Medicaid Services (CMS) Five-Star Quality Rating System includes a quality measure describing the percentage of long-stay residents with Stage II–IV or unstageable PUs.4 Publicly reported nursing-home quality information has been shown to influence facility selection and referral patterns.5,6 However, the CMS PU measure is a facility-level, risk-adjusted prevalence measure and is not designed to measure individual wound healing, incidence, or changes in wound dimensions. Its longitudinal reporting nevertheless provides an opportunity to examine changes in facility-level PU burden over time.
Vaporous hyperoxia therapy (VHT; Vaporox, Inc., U.S) is a U.S Food and Drug Administration-cleared adjunctive wound therapy that uses alternating topical concentrated oxygen and low-frequency, non-contact ultrasonic vapor mist. Previous studies have evaluated VHT in conjunction with standard wound care and reported wound-level outcomes in patients with chronic wounds, including diabetic foot ulcers and other difficult-to-heal wounds.7,8 These studies provide clinical evidence at the wound and patient level, but they do not establish whether implementation of VHT within nursing facilities is associated with changes in facility-level measures of PU prevalence. Evidence at these different levels should be distinguished: facility adoption is an implementation exposure and does not establish that individual residents contributing to a facility quality measure received VHT.
We therefore evaluated the association between facility-level VHT adoption and the publicly reported CMS long-stay PU rate among Florida nursing homes. Considering that VHT was initiated at different facilities at different times, we used a Bayesian staggered difference-in-differences design with contemporaneous matched non-adopting facilities to estimate the association between VHT adoption and changes in the facility-level CMS measure over the first four complete quarters following initiation. The study was designed to evaluate a facility-level association rather than an individual treatment effect.
METHODS
STUDY DESIGN AND SETTING
This retrospective observational study evaluated the facility-level association between VHT adoption and the CMS long-stay PU quality measure in Florida nursing homes. Florida was selected because it had the largest number of VHT placements available for this first analysis. Event time was defined relative to each facility’s initiation quarter.
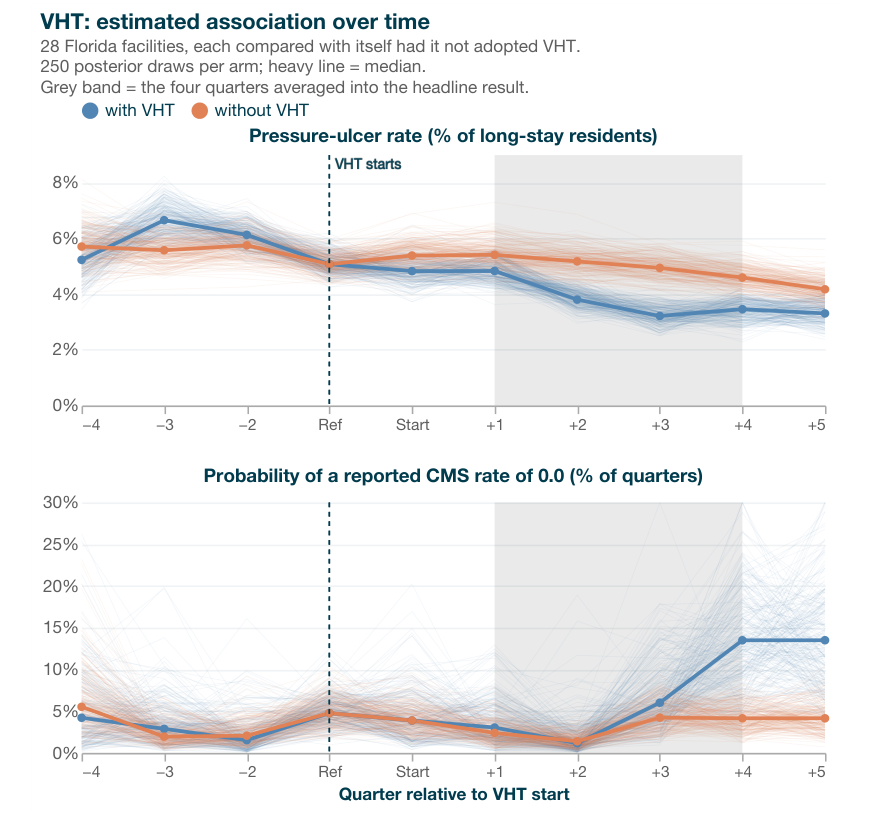
The primary observation window comprised the first four complete quarters after initiation. Event quarter refers to a calendar quarter indexed relative to the initiation quarter: quarter 0 was treated as partial exposure and modeled separately, and quarters 1–4 formed the primary estimand. A fifth post-adoption quarter was available for all four adoption cohorts and all 28 facilities because a complete run-off quarter was required for eligibility; it was retained as follow-up but excluded from the primary four-quarter estimand.
DATA SOURCES AND FACILITY IDENTIFICATION
VHT-adopting facilities were identified from sponsor device-generated treatment logs from 1 February 2024 to 30 June 2026. These were usage records, not billing or reimbursement records. Facility names were linked to CMS Certification Numbers and cross-checked against internal placement records. Initiation was defined as the first routine recorded treatment after device placement, training, and onboarding. The interval from placement to first routine treatment was at least 13 days (mean 32; median 24).
The outcome and facility covariates came from the CMS Care Compare provider-data archive, accessed on 6 August 2026. The analysis used monthly snapshots named <YYYY-MM-01>/nh_quality_msr_mds.csv and the separately named NH_QualityMsr_MDS_Jul2026.csv. Fourteen snapshots contributed retained values, spanning from 1 February 2025, snapshot through the July 2026 release and covering facility quarters from 2023Q4 through 2026Q1. As the snapshots contain overlapping rolling four-quarter windows and CMS may restate historical values, duplicate facility-quarter records were resolved by a stable chronological sort that retained the most recent release.
ELIGIBILITY AND COHORT CONSTRUCTION
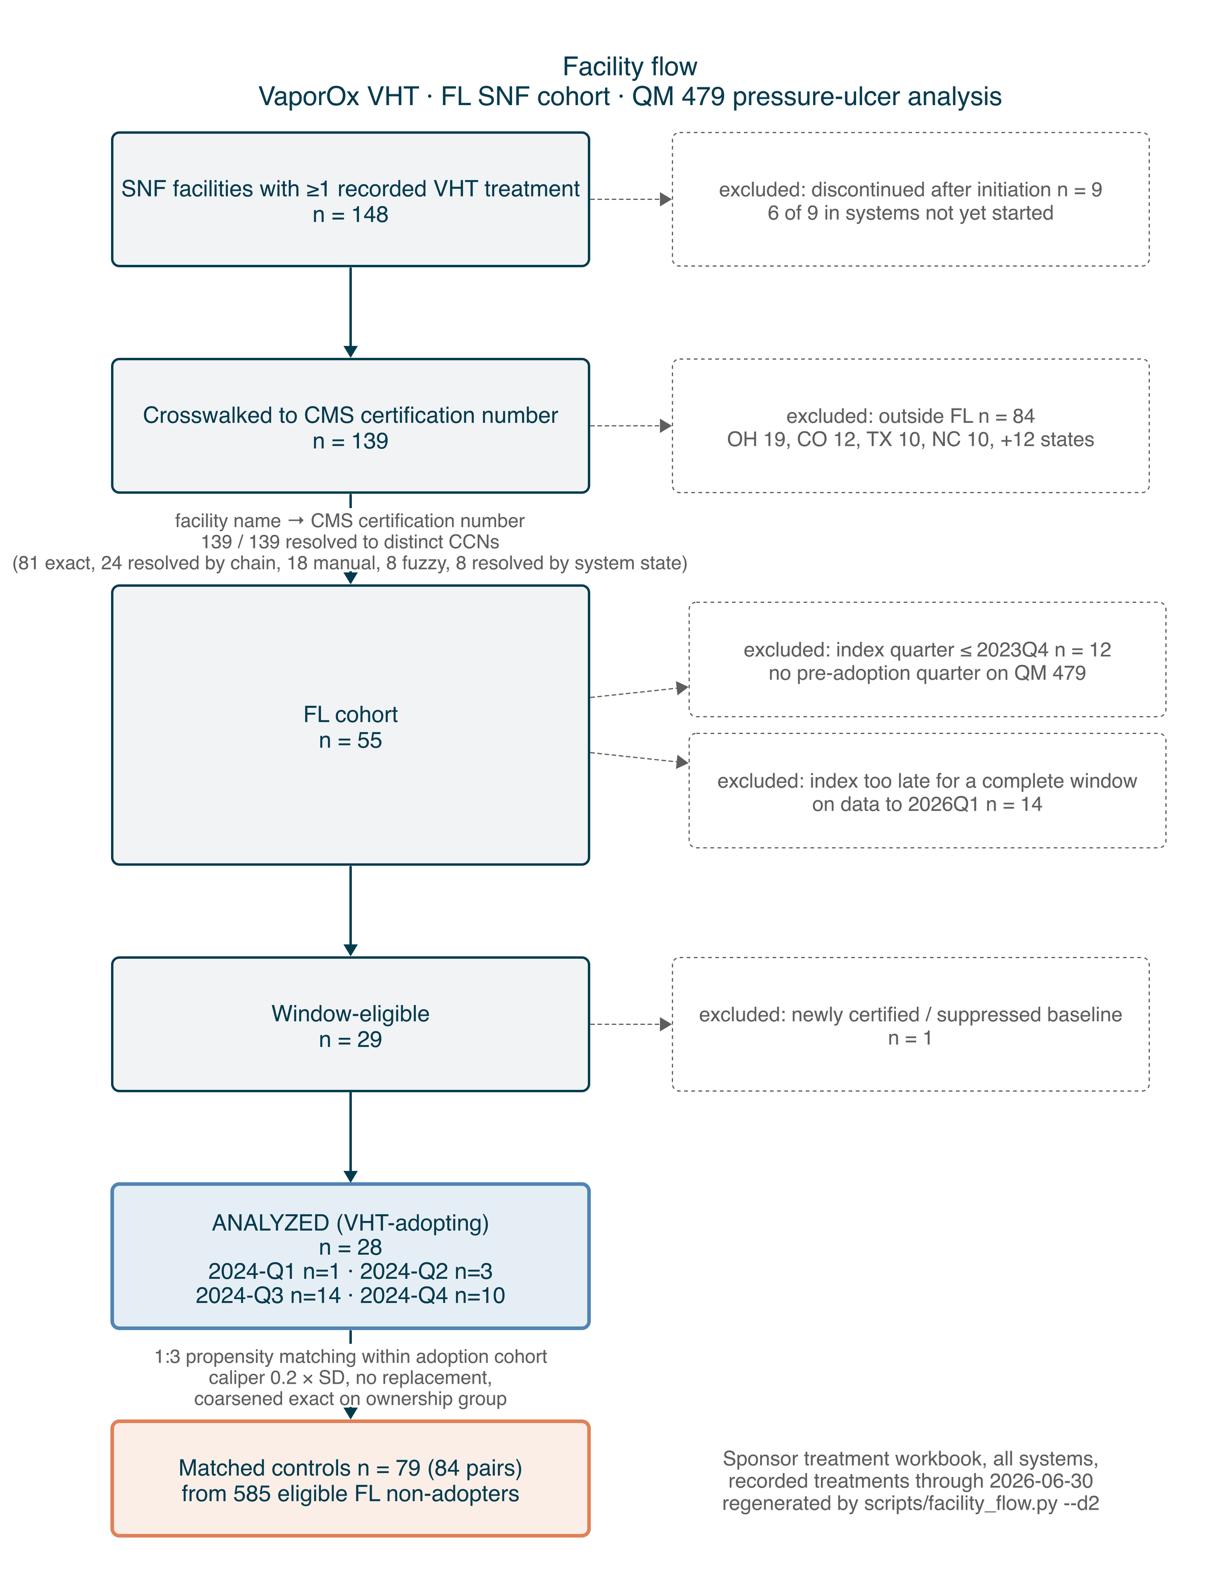
The sponsor cohort contained 148 facilities with at least one recorded treatment. Nine facilities discontinued after initiation, after 3–127 treatments and were excluded before analysis because their exposure histories could not be represented by the standard event window. None were in the analyzed Florida cohort or the comparison group. Among the remaining 139 facilities, 55 were in Florida.
Florida facilities were excluded if initiation was in 2023Q4 or earlier, if initiation was too late to provide four complete post-adoption quarters through 2026Q1, or if a usable baseline value was unavailable because of recent certification or CMS suppression. The final cohort contained 28 adopters. All 55 Florida facilities on the sponsor adopter list were removed from the donor pool at the outset. Comparison facilities therefore had no known VHT device placement during or before the analysis period, and none appeared in the sponsor’s 139-facility resolved cohort or nine-facility discontinued cohort. Absence from the sponsor device records cannot exclude VHT use obtained through an unobserved external channel.
EXPOSURE
The exposure was sustained facility-level VHT adoption, indexed to the first routine recorded treatment. Across the 28 analyzed facilities, 31,839 treatments were recorded: median 1,075 per facility (mean 1,137; range 235–3,057; interquartile range 712–1,345), median 8.79 treatments per certified bed, median 21.9 active months (minimum 17.3), and median 48.1 treatments per active month. Every facility had at least one recorded treatment during 18–30 June 2026, indicating continued use near the data cutoff. As no analyzed facility had fewer than 235 treatments, plausible minimum-use thresholds did not alter cohort membership. Adoption is an implementation marker and does not assign treatment to individual residents.
OUTCOME MEASURE
The primary outcome was CMS Care Compare measure 479, percentage of long-stay residents with PUs (MDS quality-measure ID N045.02; Measures Inventory Tool ID 512). Contemporary clinical nomenclature often uses ‘pressure injury’; we use ‘pressure ulcer’ when referring to the formal CMS measure and throughout the manuscript for consistency. CMS defines the numerator using Stage II–IV or unstageable PU items at the selected Minimum Data Set target assessment. The denominator comprises eligible long-stay residents with a selected target assessment; admission and five-day Prospective Payment System assessments and records with missing required pressure-ulcer items are excluded under the MDS 3.0 Quality Measures User’s Manual. The N045.02 specification is unchanged between Version 17.0 (effective January 1, 2025) and Version 18.0 (effective January 1, 2026), the two editions spanning the analysis window; the Version 18.0 specification appears in Table 2–29 on page 44. CMS publishes a risk-adjusted facility percentage rather than resident-level counts.9 A displayed value of 0.0 is therefore a rounded, risk-adjusted public estimate and cannot establish that no resident had a qualifying PU. CMS-footnoted observations for too few residents or unavailable data were treated as missing and were never classified as 0.0.
ENDPOINTS
The single primary endpoint was the quarterly facility-level CMS PU rate. The primary estimand was the standardized contrast between outcomes under observed adoption and the counterfactual outcomes expected for the same adopting facilities without adoption, averaged across event quarters 1–4.
The hurdle model’s probability component describes the probability of a reported CMS rate of 0.0. It was added after inspection of the outcome distribution and is reported as an exploratory decomposition of the primary rate endpoint, not as a second primary endpoint or a separate success criterion. The overall rate equals the product of the probability of a nonzero report and the conditional positive rate.
MATCHING AND STATISTICAL ANALYSIS
Propensity scores were estimated within adoption-quarter cohorts using baseline CMS pressure ulcer rate, overall Five-Star rating, log certified beds, occupancy, case-mix-adjusted nurse hours per resident-day, long-stay quality-measure rating, staffing rating, health-inspection rating, urban location, ownership, and cohort. Facilities under common corporate ownership are referred to as belonging to the same operator, identified by the CMS chain name in the Care Compare provider file. Matching used a 1:3 ratio, a caliper of 0.2 standard deviations of the logit score, no replacement within cohort, and exact matching on ownership category. All VHT-adopting facilities were within their cohort-specific donor range, and none was excluded for lack of common support. The comparison-arm Kish effective sample size was 73.5 among 79 unique facilities.
Overall, 75 comparison facilities were used once, three twice, and one three times, producing 84 pair-slots. A pair-slot is one adopter-comparison match within an adoption cohort. Reused facilities contributed once per cohort served, and each pair-slot received equal weight. A facility random intercept shared information across repeated appearances, with an operator random intercept above it. The operator random effect prevents 26 facilities under one operator from being treated as 26 independent units; it is a variance component, not a confounding control, and cannot identify an operator-level confounder because no facility from the dominant operator appears in the comparison arm. Case-mix-adjusted nurse hours remained imbalanced after matching (standardized mean difference 0.292) and entered both model components; residual staffing-rating imbalance remained a limitation.
The primary analysis used a Bayesian staggered difference-in-differences hurdle-beta model, avoiding a pooled two-way fixed-effects specification for staggered treatment adoption.10 Continuous covariates were z-standardized, with certified beds log-transformed first. Identification requires conditional parallel trends, no anticipation, no comparison-facility exposure, and stable facility composition.10 The first two assumptions are not directly verifiable with the available short pre-period.
For each posterior draw, each adopting facility was predicted twice—once under its observed event-time effects and once with those effects set to zero—while retaining its covariates, calendar position, and random effect. Predictions were averaged on the response scale with equal weight for each of the 28 facilities; adoption cohorts therefore contributed in proportion to their sizes (1, 3, 14, and 10). Absolute percentage-point differences are reported before relative contrasts.
Priors and sampling settings followed the analysis plan. Models were fitted in Python 3.14.6 using PyMC 6.2.0 with the nutpie 0.16.11 No-U-Turn sampler and summarized with ArviZ 1.2.0. The reported posterior was generated on August 6, 2026, with a fixed seed. Normal(0,1) priors were applied to standardized fixed effects and event-time coefficients on their link scales; Normal(−3,1.5) priors were used for intercepts; HalfNormal(1) priors for facility and operator standard deviations; and HalfNormal(50) for beta precision. Four chains used 3,000 warm-up and 6,000 retained draws per chain, target acceptance 0.99, and a fixed seed. Convergence required no post-warm-up divergences, Rs <1.01, and bulk and tail effective sample sizes >400.
SENSITIVITY AND MODEL ASSESSMENT
Sensitivity analyses included 1:1 matching, matching with replacement, omission of the operator random effect, narrower and wider fixed-effect priors, a wider facility standard-deviation prior, inverse-probability weighting with and without trimming, unique comparison controls, an alternative e=−2 reference quarter, and exclusion of adopters with divergent pre-period trajectories. The original analysis protocol (dated 8 July 2026, executed 14 July 2026) prespecified the principle of excluding materially divergent pre-period trajectories, but the >2-percentage-point numeric cutoff was selected during implementation and was therefore post hoc in form. This analysis is presented as a sensitivity analysis and not as confirmation of parallel trends. Bayesian synthetic control and comparative interrupted time-series models provided alternative counterfactual designs.
Pre-adoption assessment included cohort-specific plots and posterior slope contrasts. The limited-pre-period sensitivity approach of Rambachan and Roth11 was considered but not implemented because the estimand uses Bayesian response-scale g-computation under a hurdle likelihood and the earliest pre-period included only 10 adopters. Prior and posterior predictive checks, power-scaling diagnostics, and leave-one-out cross-validation assessed calibration and influence.
This study was reported in accordance with the Strengthening the Reporting of Observational Studies in Epidemiology (STROBE) statement and the REporting of studies Conducted using Observational Routinely collected health Data (RECORD) extension.12,13
ETHICAL APPROVAL AND PATIENT CONSENT
The study used facility-level sponsor usage records and public CMS facility-level data. It included no direct participant contact or resident-level protected health information and did not constitute human-subjects research; institutional review board approval and individual consent were not required.
RESULTS
FACILITY COHORT AND EXPOSURE
Of 148 sponsor-listed facilities with recorded use, 9 discontinued after initiation, leaving 139 linked facilities; 84 were outside Florida. Of 55 Florida facilities, 12 initiated too early for an eligible baseline, 14 initiated too late for complete follow-up, and one lacked a usable baseline. The final cohort contained 28 adopters. Initiation occurred in 2024Q1 (n=1), 2024Q2 (n=3), 2024Q3 (n=14), and 2024Q4 (n=10). All 28 had event quarter 5 available (Figure 1; Table 1).
The 28 adopters were matched to 79 unique comparison facilities from 585 eligible Florida non-adopters. A total of 26 adopters belonged to one operator, one to Clear Choice Healthcare, and one to FL SNF Trust. The dominant operator initiated VHT in all 31 of its Florida facilities, so no within-operator non-adopting controls existed. Excluding the dominant operator would leave two adopters and could not support an event study.
Table 1. Construction of the VHT-adopting cohort
| Cohort step | Facilities | Excluded | Reason |
|---|---|---|---|
| ≥1 recorded treatment | 148 | — | — |
| After discontinuation exclusion | 139 | 9 | Discontinued after 3–127 treatments |
| Florida cohort | 55 | 84 | Located outside Florida |
| Window-eligible cohort | 29 | 26 | Initiation ≤2023Q4 (12); incomplete follow-up (14) |
| Analyzed VHT adopters | 28 | 1 | New certification or suppressed baseline |
| Matched comparison group | 79 unique | — | 84 pair-slots from 585 eligible non-adopters |
Table 2. Standardized four-quarter estimands
| Estimand over event quarters 1–4 | Estimate | 95% CrI |
|---|---|---|
| Primary: CMS PU rate difference | −1.22 percentage points | −2.07 to −0.42 |
| Derived from the primary model: relative reduction in CMS PU rate | 23.7% | 9.6% to 36.2% |
| Derived from the primary model: counterfactual CMS PU rate | 5.05% | 4.35% to 5.84% |
| Exploratory: difference in probability of a reported CMS rate of 0.0 | +3.33 percentage points | −0.37 to +7.97 |
| Exploratory: probability ratio for a reported CMS rate of 0.0 | 1.99 | 0.91 to 4.11 |
EVENT-TIME AND PRE-ADOPTION ASSESSMENT
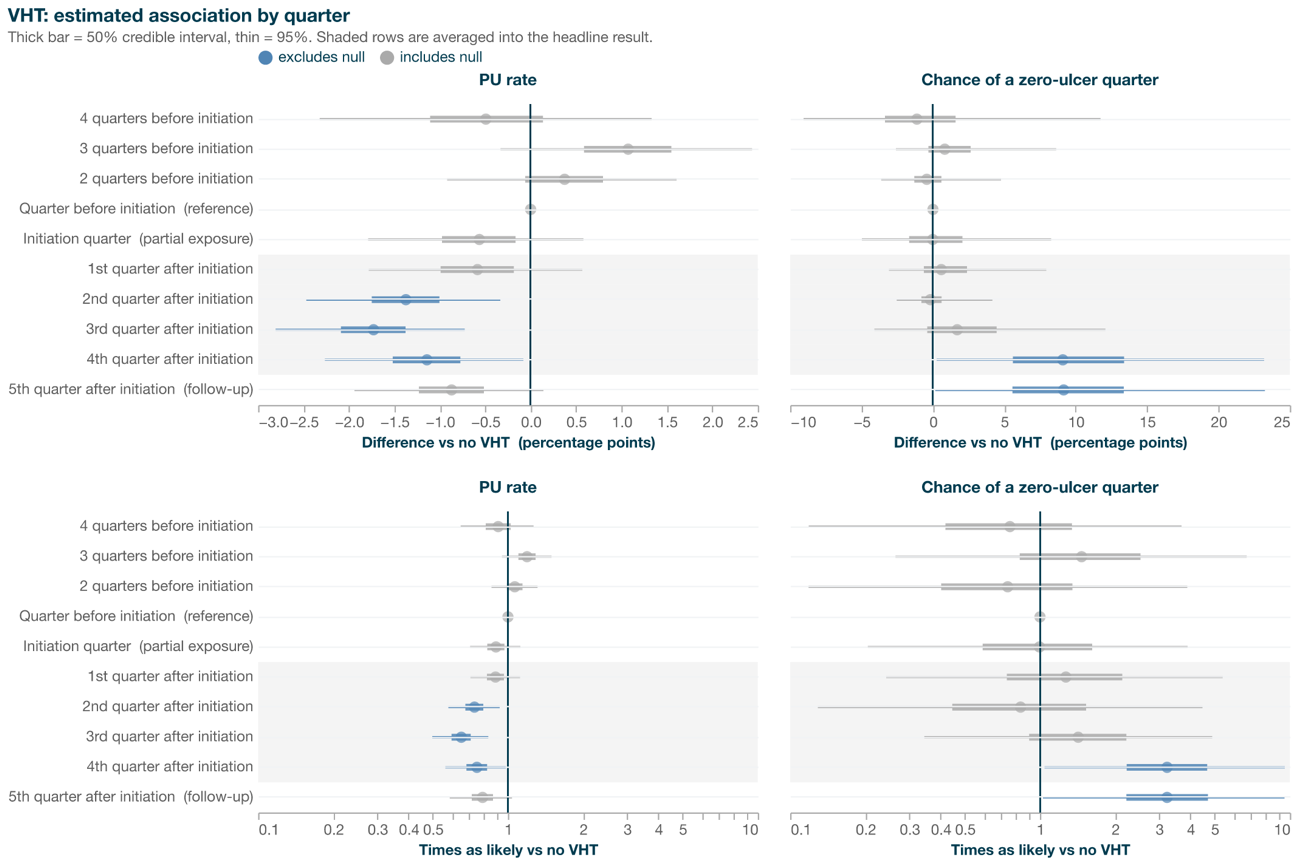
Rate differences were −0.58 percentage points in the initiation quarter, −0.59 in event quarter 1, −1.38 in quarter 2, −1.74 in quarter 3, −1.15 in quarter 4, and −0.88 in quarter 5 (Table 3, Figure 3). The pooled pre-adoption difference was +0.31 percentage points (95% CrI, −0.80 to +1.39). Contributors at e=−4, −3, −2, and −1 were 10, 24, 27, and 28 adopting facilities and 30, 69, 76, and 79 unique comparison facilities, corresponding to 30, 72, 81, and 84 comparison facility-quarters.
The contributor-weighted differential pre-trend slope was −0.116 percentage points per quarter (95% CrI, −0.630 to +0.402); equal weighting gave +0.076 (95% CrI, −0.490 to +0.642). The sign changed with weighting, underscoring low power. Linear continuation of the weighted drift implied −0.406 percentage points over e=1–4 (95% CrI, −2.205 to +1.407), with posterior probability 0.187 that it could explain the full observed association.
Using e=−2 as the reference produced −1.32 percentage points (95% CrI, −2.19 to −0.56), compared with −1.22 in the primary model. The divergent-preperiod deletion analysis retained 13 adopters and estimated −1.30 percentage points, with a pooled preperiod difference of +0.06 (95% CrI, −1.16 to +1.52). This does not confirm parallel trends.
Table 3. Event-time PU rate differences and contributors
| Event time | Difference, pp | 95% CrI | VHT facilities | Comparison facilities | Comparison facility-quarters |
|---|---|---|---|---|---|
| 4 quarters before initiation (e=−4) | −0.49 | −2.32 to +1.33 | 10 | 30 | 30 |
| 3 quarters before initiation (e=−3) | +1.07 | −0.33 to +2.44 | 24 | 69 | 72 |
| 2 quarters before initiation (e=−2) | +0.36 | −0.92 to +1.61 | 27 | 76 | 81 |
| Quarter before initiation (reference, e=−1) | 0.00 | — | 28 | 79 | 84 |
| Initiation quarter (partial exposure, e=0) | −0.58 | −1.79 to +0.58 | 28 | 79 | 84 |
| 1st quarter after initiation (e=1) | −0.59 | −1.78 to +0.57 | 28 | 79 | 84 |
| 2nd quarter after initiation (e=2) | −1.38 | −2.47 to −0.33 | 28 | 79 | 84 |
| 3rd quarter after initiation (e=3) | −1.74 | −2.81 to −0.73 | 28 | 79 | 84 |
| 4th quarter after initiation (e=4) | −1.15 | −2.26 to −0.08 | 28 | 79 | 84 |
| 5th quarter after initiation (follow-up, e=5) | −0.88 | −1.94 to +0.14 | 28 | 79 | 84 |
MATCHING, SENSITIVITY, AND MODEL CHECKS
After 1:3 matching, one of 11 covariates exceeded |0.25| and three exceeded |0.10|. The 1:1 alternative had four and five covariates above those thresholds, respectively. A unique controls analysis estimated −1.20 percentage points versus −1.22 in the primary analysis, a +0.017-point shift; both had posterior probability 0.999 of a reduction.
Across 10 primary-analysis variations, rate differences ranged from −0.75 to −1.34 percentage points; all favored adoption and eight had 95% CrIs excluding zero. Bayesian synthetic control estimated −1.07 (95% CrI, −1.77 to −0.37), and comparative interrupted time series estimated −1.21 (95% CrI, −1.77 to −0.66) (Table 4).
All 9 observed posterior predictive statistics fell inside their 95% predictive intervals. Posterior predictive probabilities ranged from 0.09 to 0.74. The proportion of facility-quarters with a reported CMS rate of 0.0 were 6.61% among adopters and 3.50% among comparisons, reproduced by the model. Prior predictive simulation placed 15.1% of mass above 40 percentage points despite an observed maximum of 18.6, reflecting intentionally broad priors. Halving or doubling fixed-effect prior scales changed the primary estimate by 0.09 percentage points. Power scaling identified the operator-level standard deviation as prior-driven and seven of ten zero-component effects as sensitive; rate event-time effects were substantially more likelihood- than prior-sensitive.
Table 4. Four-quarter PU rate contrast across analytic designs
| Analytic design | Difference, percentage points | 95% CrI |
|---|---|---|
| Staggered difference-in-differences (primary) | −1.22 | −2.07 to −0.42 |
| Bayesian synthetic control | −1.07 | −1.77 to −0.37 |
| Comparative interrupted time series | −1.21 | −1.77 to −0.66 |
| Unique comparison controls | −1.20 | −2.04 to −0.40 |
Note: The unique-controls sensitivity used the lighter sampler configuration applied to all sensitivity analyses. Its estimate differed from the primary specification by +0.02 percentage points. The primary row reports the full configuration specified in Methods.
Discussion
In this retrospective facility-level study, VHT adoption was associated with a 1.22-percentage-point lower CMS long-stay PU rate over the first four complete post-adoption quarters, equivalent to a 23.7% relative reduction from the estimated counterfactual rate. Absolute differences are emphasized because they are directly interpretable on the published CMS percentage scale. The association was directionally consistent across alternative analytic designs and sensitivity analyses, including the analysis restricted to unique comparison controls. The exploratory reported-0.0 component was estimated less precisely, and its pooled 95% CrI included no association.
These findings extend but should be distinguished from previous evidence on VHT. Prior studies have evaluated VHT in conjunction with standard wound care using wound- or patient-level outcomes and have reported improvement in chronic wounds, including diabetic foot ulcers and other difficult-to-heal wounds.7,8 The present study addresses a different level of inference: whether facility-level implementation of VHT was associated with change in a population-level nursing-home quality measure. It therefore does not provide confirmatory evidence of an individual treatment effect. The direction of the facility-level association observed here is consistent with that reported in prior wound-level studies, although the different outcomes and levels of analysis preclude direct comparison.
PUs remain an important problem in nursing-home populations. A recent systematic review and meta-analysis of older people living in nursing homes estimated a pooled PU prevalence of 11.6% across all stages and 7.2% when Stage I PUs were excluded, although substantial heterogeneity was present across studies.14 These estimates are not directly comparable with the CMS measure used in the present study because populations, assessment methods, PU definitions, and risk adjustment differ. They nevertheless demonstrate that PUs continue to represent a substantial burden in nursing-home care. Previous studies have also shown that structured approaches to PU management can improve aspects of care in skilled nursing facilities, further supporting the importance of evaluating facility-level wound-care practices and their implementation.3 The CMS measure evaluated here should, however, be interpreted as a quality indicator rather than a direct measure of individual wound healing or the overall quality of PU care. Earlier research examining the Minimum Data Set PU indicator found that nursing homes with lower reported PU prevalence did not consistently demonstrate better PU care processes than facilities with higher reported prevalence.15 In the present study, CMS measure 479 is a risk-adjusted prevalence percentage based on selected resident assessments and may change through multiple pathways, including healing or progression of existing wounds, development of new wounds, resident turnover, assessment timing, case mix, documentation, hospitalization, or death. A published CMS value of 0.0 is similarly a rounded, risk-adjusted rate without a published numerator or denominator and cannot be interpreted as proof that no resident had a qualifying PU.
Although the present study cannot identify the mechanism underlying the observed facility-level association, previous wound literature provides relevant biological and clinical context. Topical oxygen therapy has been associated with improved wound healing in randomized and observational studies, including a recent meta-analysis, although the evidence spans heterogeneous wound populations and treatment approaches.16 PU development and persistence are also influenced by mechanical tissue injury and local ischemia-reperfusion stress,17,18 while wound-bed preparation and management of devitalized tissue and biofilm are established components of chronic wound management.19,20 These mechanisms provide biological plausibility for therapies that modify the wound microenvironment, but they cannot explain the association observed in the present study. Individual residents, wound types, treatment indications, and wound trajectories were not linked to the CMS outcome, and facility adoption should therefore be understood as an implementation marker rather than individual-level treatment assignment.
The temporal pattern of the association also requires cautious interpretation. Estimated differences were smaller during the initiation and first complete post-adoption quarters and larger during the second and third quarters, with some attenuation thereafter. Although such a pattern could be compatible with a change emerging after implementation, the study cannot establish that it represents a treatment-response trajectory. In staggered difference-in-differences designs, interpretation depends on assumptions including conditional parallel trends and absence of anticipation.10 The available pre-adoption period was short and uneven across cohorts: only 10 adopting facilities contributed to the earliest pre-adoption estimate, and the estimated differential pre-trend changed sign according to weighting. The alternative baseline and slope analyses provide useful information about the robustness of the estimate but do not establish the parallel-trends assumption. Consistent with methodological work emphasizing the limitations of relying on non-significant pre-trend tests,11 the absence of a credible pre-adoption difference should not be interpreted as evidence of equivalence.
The operator, or operating system concentration is similarly important when interpreting the findings. Overall, 26 of the 28 adopting facilities belonged to a single operator, which implemented VHT across all 31 of its Florida facilities. A contemporaneous non-adopting comparison within that operator was therefore unavailable. Introduction of a new wound-care technology at the facility or operator level may occur alongside changes in training, documentation, staffing, prevention practices, referral patterns, or broader quality-improvement activities. These factors were not available in the present data and cannot be separated from VHT adoption. The operator random effect accounts for statistical clustering but does not provide the missing within-system counterfactual. Consequently, the observed association may reflect VHT implementation, other concurrent changes within the dominant operator, or a combination of these factors.
The findings identify several priorities for further study. Replication across nursing facilities in different states and operators would help determine whether the association is observed outside this implementation context. Linking facility implementation data to resident-level VHT exposure, wound characteristics, treatment frequency, and longitudinal outcomes would allow direct evaluation of whether changes in the CMS measure correspond to changes in individual wound outcomes. Other potentially relevant facility-level outcomes, including hospitalization, re-admission, staffing, Value-Based Purchasing measures, and economic outcomes, should be evaluated separately rather than inferred from the association observed here.
Limitations
Several limitations should be considered. First, this retrospective observational study cannot exclude residual or unmeasured confounding and does not establish a causal treatment effect. The short and uneven pre-adoption period limited assessment of the conditional parallel-trends assumption, and the alternative baseline, slope, and sensitivity analyses provide context but do not verify that assumption. Residual covariate imbalance also remained after matching, particularly for staffing rating.
Second, the CMS outcome is an aggregated, risk-adjusted facility-level prevalence measure without resident-level numerators or denominators. Individual VHT exposure, wound type, incidence, healing, progression, and resident turnover were unavailable; consequently, the processes underlying the observed change cannot be determined. Although repeated comparison facilities were accounted for in the model and the unique-controls sensitivity produced a similar estimate, some dependence and model specification uncertainty remain.
Finally, generalizability is limited to the Florida setting, the small number of adopting facilities, and concentration of 26 of the 28 adopting facilities within a single operator. The operator random effect does not substitute for a within-system counterfactual, and concurrent operator-wide changes could not be evaluated. Bayesian estimates are also conditional on the specified model and priors; although the primary rate estimates were comparatively robust, greater prior sensitivity was observed for the operator-level variance and several parameters of the exploratory reported-0.0 component.
Conclusion
VHT adoption was associated with a lower publicly reported CMS long-stay PU rate among 28 Florida nursing-homes over the first four complete post-adoption quarters. This finding represents a facility-level observational association and should not be interpreted as evidence of an individual treatment effect or causal relationship. The concentration of adopting facilities within one operator and the limited pre-adoption period further constrain interpretation and generalizability. Replication across additional nursing-home systems, together with linkage of facility implementation to resident- and wound-level outcomes, is needed to determine whether the observed association is reproducible and to better understand the processes underlying it.
Author Contributions: Conceptualization A.N.R.-W., Z.T., and D.S.; methodology Z.T.; software Z.T.; validation S.F. and Z.T.; formal analysis Z.T.; data curation Z.T.; writing − original draft preparation A.N.R.-W.; writing − review and editing S.F., A.N.R.-W., Z.T.; supervision A.N.R.-W. and D.S.; funding acquisition D.S.; project administration A.N.R.-W. and D.S. All authors have read and agreed to the published version of the manuscript.
Received: 28 August 2026 | Accepted: 2 October 2026 Funding: This research was funded by Vaporox, Inc.
Institutional Review Board Statement: The study used facility-level sponsor usage records and public CMS facility-level data; therefore, institutional review board approval was not required under applicable institutional and regulatory definitions.
Informed Consent Statement: The study did not include direct participant contact or resident-level protected health information and did not constitute human-subjects research; therefore, individual consent was not required.
Data Availability Statement: CMS outcome and covariate data are publicly available through the CMS Care Compare provider-data archive. Analysis code using the public CMS inputs, derived analytic frames, the complete model specification, facility-linkage methods, and de-identified exposure summaries sufficient to reproduce the exposure classification are available from the corresponding author on reasonable request. Requests are reviewed and approved by the corresponding author.
Acknowledgments: The authors thank Dr. Jeanine Maguire for pre-submission review of this manuscript.
Declaration of Generative AI: The authors used AI as a supportive writing tool to assist with idea organization, refinement of logical flow, and internal consistency checks against a predefined checklist. Occasional assistance was also used to improve sentence clarity (ChatGPT v5.6). AI assistance was used in developing and documenting the statistical analysis code, under author direction and review (Anthropic Claude Opus 5 and Sonnet 5). All design decisions, model specification, analytical interpretation and final wording remain the responsibility of the authors.
Conflicts of Interest: This work was funded by Vaporox, Inc., the manufacturer of VHT. D.S. is a paid employee of Vaporox, Inc. A.N.R.-W. is a paid consultant to Vaporox, Inc. S.F. and Z.T. are employees of Open Wound Research, which received study support from Vaporox, Inc. All authors accept responsibility for the integrity and accuracy of the work.
Disclaimer/Publisher’s Note: The statements, opinions and data contained in all publications are solely those of the individual author(s) and contributor(s) and not of CWCMR and/or the editor(s). CWCMR and/or the editor(s) disclaim responsibility for any injury to people or property resulting from any ideas, methods, instructions or products referred to in the content.
REFERENCES
- Hajhosseini B, Longaker MT, Gurtner GC. Pressure injury. Ann Surg. 2020; 271(4):671–679. https://doi.org/10.1097/SLA.0000000000003567
- Rahim K, Saleha S, Zhu X et al. Bacterial contribution in chronicity of wounds. Microb Ecol. 2017; 73(3):710–721. https://doi.org/10.1007/s00248-016-0867-9
- Au Y, Holbrook M, Skeens A et al. Improving the quality of pressure ulcer management in a skilled nursing facility. Int Wound J. 2019; 16(2):550–555. https://doi.org/10.1111/iwj.13112
- Centers for Medicare & Medicaid Services. Design for Care Compare Nursing Home Five-Star Quality Rating System: Technical Users’ Guide. https://www.cms.gov/medicare/provider-enrollment-and-certification/certificationandcomplianc/downloads/usersguide.pdf
- Perraillon MC, Konetzka RT, He D, Werner RM. Consumer response to composite ratings of nursing home quality. Am J Health Econ. 2019; 5(2):165–190. https://doi.org/10.1162/ajhe_a_00115
- Fuller RL, Goldfield NI, Hughes JS, McCullough EC. Nursing Home Compare star rankings and variation in potentially preventable emergency department visits and hospital admissions. Popul Health Manag. 2019; 22(2):144–152. https://doi.org/10.1089/pop.2018.0065
- Armstrong DG, Kruse D, Carter MJ et al. Retrospective analysis of vaporous hyperoxia therapy as an adjunct to standard wound care in chronic wounds. Wounds. 2025; 37(2):56–62. https://doi.org/10.25270/wnds/24075
- Kruse D, Morgan K, Christensen J et al. Treatment of nonhealing diabetic foot wounds with vaporous hyperoxia therapy in conjunction with standard wound care. J Am Podiatr Med Assoc. 2023; 113(2):20259. https://doi.org/10.7547/20-259
- Centers for Medicare & Medicaid Services. MDS 3.0 Quality Measures User’s Manual, Version 18.0. https://www.cms.gov/medicare/quality/nursing-home-improvement/quality-measures
- Callaway B, Sant’Anna PHC. Difference-in-differences with multiple time periods. J Econom. 2021; 225(2):200–230. https://doi.org/10.1016/j.jeconom.2020.12.001
- Rambachan A, Roth J. A more credible approach to parallel trends. Rev Econ Stud. 2023; 90(5):2555–2591. https://doi.org/10.1093/restud/rdad018
- von Elm E, Altman DG, Egger M et al. The Strengthening the Reporting of Observational Studies in Epidemiology statement: guidelines for reporting observational studies. Lancet. 2007; 370(9596):1453– 1457. https://doi.org/10.1016/S0140-6736(07)61602-X
- Benchimol EI, Smeeth L, Guttmann A, et al. The REporting of studies Conducted using Observational Routinely-collected health Data (RECORD) statement. PLoS Med. 2015; 12(10):e1001885. https://doi.org/10.1371/journal.pmed.1001885
- Sugathapala RU, Latimer S, Balasuriya A et al. Prevalence and incidence of pressure injuries among older people living in nursing homes: a systematic review and meta-analysis. Int J Nurs Stud. 2023; 148:104605. https://doi.org/10.1016/j.ijnurstu.2023.104605
- Bates-Jensen BM, Cadogan M, Osterweil D, et al. The Minimum Data Set pressure ulcer indicator: does it reflect differences in care processes related to pressure ulcer prevention and treatment in nursing homes? J Am Geriatr Soc. 2003;51(9):1203–1212. https://doi.org/10.1046/j.1532-5415.2003.51403.x
- Putri IL, Alyssa A, Aisyah IF, et al. The efficacy of topical oxygen therapy for wound healing: a meta-analysis of randomized controlled trials and observational studies. Int Wound J. 2024; 21(7):e14960. https://doi.org/10.1111/iwj.14960
- Murata E, Fujii J. Ischemia/reperfusion-associated oxidative stress is an aggravating factor for pressure ulcers. J Clin Biochem Nutr. 2025; 76(3):221–232. https://doi.org/10.3164/jcbn.25-28
- Fife CE, Gkotsoulias E. On the origin of intraoperative pressure injury: an angiosomal theory of pressure injury formation. Adv Wound Care (New Rochelle). 2019; 8(11):580–584. https://doi.org/10.1089/wound.2018.0905
- Tettelbach WH, Cazzell SM, Hubbs B et al. The influence of adequate debridement and placental-derived allografts on diabetic foot ulcers. J Wound Care. 2022; 31(Suppl 9):S16–S26. https://doi.org/10.12968/jowc.2022.31.Sup9.S16
- Manna B, Nahirniak P, Morrison CA. Wound debridement. In: StatPearls [Internet]. StatPearls Publishing. https://www.ncbi.nlm.nih.gov/books/NBK507882/